Analysis
Total serum protein and albumin are determined directly in a routine manner; total serum globulin is determined by the difference:
     total protein + Biuret reagent  ------>  purple colored
                            (alkaline Cu++)              Cu-peptide bond
                                                                   complex

     albumin + BromCresyl Green  ------>  intense green colored
                                                                       Alb-BCG complex

     serum globulin  =  total protein  -  albumin
___________________________________________________________________
Clinically important serum proteins of lower concentration are measured
by specific techniques:

1.  lipoproteins              --   lipid staining of electropheretic strips,
                                   serum lipid determinations,
                                   determination of apoproteins

2.  thyroxin binding          --   radiolabeled tri-iodothyronine (T3)
     globulin (TBG)                binding capacity

3.  transferin                --   iron binding capacity
                                   or immunochemical determination
                                  _
4.  alpha-1-antitrypsin            |
                                   |
5.  IgG, IgA or IgM                |
                                    >  immunochemical determination
6.  C3 or C4 components            |
    of complement                  |
                                   |
7.  C-reactive protein (CRP)      _|
Pathologic Serum Protein Concentrations
Somewhat more than half of total serum globulin is accounted for by immunoglobulin in the gamma band. Noticeable alterations in total serum protein are almost always due to alterations in immunoglobulins and/or albumin; because concentrations of individual proteins in the alpha and beta bands are relatively low, changes in their concentrations rarely affect total protein or total serum globulin values. Albumin is elevated only in dehydration, but is decreased in a number of pathologic conditions. Increased total protein or total serum globulin is almost always due to increased immunoglobulins. Many of the individual alpha and beta globulins are of clinical significance and are determined by specific quantitative techniques.
Serum protein electrophoresis

Serum protein electrophoresis may be requested when total serum protein, albumin and/or total serum globulins are found to be abnormal. Electrophoresis is conducted by applying specimen at the origin, indicated by the dashed line in the figure to the right, on a cellulose acetate or agarose electrophoresis plate. A high voltage causes proteins to migrate at a rate determined by their net electrostatic charge and their size. Proteins are visualized by using a dye which stains all proteins in an equivalent manner. Protein staining with a red dye is illustrated in the example.
Certain other particular proteins may be visualized by using appropriate stains; for example lipoproteins are observed by using a fat stain, and isoenzymes are demonstrated using a substrate ---> product stain. A recorder tracing of the stained electrophoretic strip is obtained by scanning with a densitometer, which also provides quantification of the individual bands.
Hepatic Cirrhosis -- When liver function is sufficiently diminished, protein synthesizing capacity is compromised and concentrations of albumin and proteins in the alpha and beta bands are decreased. An additional common finding is beta-gamma bridging due to increased IgA.
The Nephrotic Syndrome -- Renal disease involving the glomeruli is always associated with increased urinare protein loss. When protein loss is greater than 3-4 g/day, the protein synthesizing capacity of the liver is exceeded and hypoproteinemia, accompanied by anasarca, develops to cause the nephrotic syndrome. The massive urine protein loss is due to increased permeability of glomeruli to protein. The permeability increase may be minimal so that only albumin and other smaller molecular weight proteins are selectively filtered (selective nephrosis, as in Minimal Change Disease) or may be greater so that larger proteins are also filtered (nonselective nephrosis, as in membranous golmerulonephritis) as is the case in the example shown. Alpha-2-macroglobulin is sufficiently large so that it is not filtered and increased synthesis (from the general hepatic protein synthesis) causes its accumulation. Lipoproteins are also sufficiently large to accumulate and hyperlipidemia is a characteristic of the nephrotic syndrome, although lipoproteins are not stained with the protein stain used in visualizing proteins.
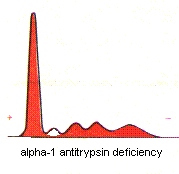
Alpha-1-Antitrypsin Deficiency -- A genetic defect causes a deficiency of alpha-1-antitrypsin. The antiprotease deficiency results in a propensity to develop emphysema. Since
alpha-1-antitrypsin is the major component of the alpha-1 band, deficiency is suggested by a reduced alpha-1 band. Deficiency is confirmed by specific immunochemical quantification.
Acute Inflammation
The alpha-1 and alpha-2 bands are increased during the inflammatory response from increased hepatic synthesis of acute phase reactant proteins.
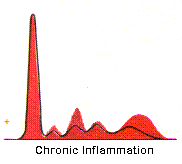
Chronic Inflammation -- Immunoglobulin synthesis by antigen activated B lymphocytes transformed to plasma cells is demonstrated by the increased polyclonal gamma band.
Immunoglobulin Deficiency -- Deficient immunoglobulin synthesis is revealed by a markedly diminished gamma band. Effected individuals are prone to recurrent infection.
Monoclonal Gammopathy -- An unusually sharp band in the gamma region strongly suggests the presence of a homogeneous immunoglobulin and, thus, the malignant proliferation of plasma cells from a single cell (multiple myeloma) in contrast to the broad, heterogeneous, or polyclonal, gamma band as exhibited above in chronic inflammation from immunoglobulin synthesis by many different clones of plasma cells. Homogeneous immunoglobulins are also found in Waldenstrom's macroglobulinemia (where the sharp gamma band is always IgM). Specimens which exhibit a narrow gamma band are further examined by immunofixation electrophoresis as described below


